Decoding your gut health report just got easier. Learn how to interpret microbial diversity, key bacteria, functional pathways, and personalized recommendations from your MapMyBiome results.
Your gut microbiome is like a bustling ecosystem inside you, influencing digestion, immunity, and even mood. MapMyBiome's advanced gut test provides a detailed report that goes beyond basic scans. This guide breaks down understanding microbiome analysis step by step, helping you turn data into actionable insights for better health.
MapMyBiome Gut Health Report
Ever stared at your MapMyBiome report wondering what those numbers mean? You're not alone. This report reveals your unique microbial profile, highlighting diversity, key species, and health risks tailored to your lifestyle—especially relevant for Indians with spice-rich diets.
We'll cover everything from diversity scores to personalized diet tips, using real sample insights. By the end, you'll confidently use your gut microbiome test results explained to optimize your health.
Core Sessions in MapMyBiome Gut Health Report
-
Gut Score
-
Microbial Diversity
-
Species-Level Identification
-
Functional Pathways Analysis
-
Health Risk Assessment
-
Personalized Recommendations
MapMyBiome Gut Health Report-Indepth Analysis
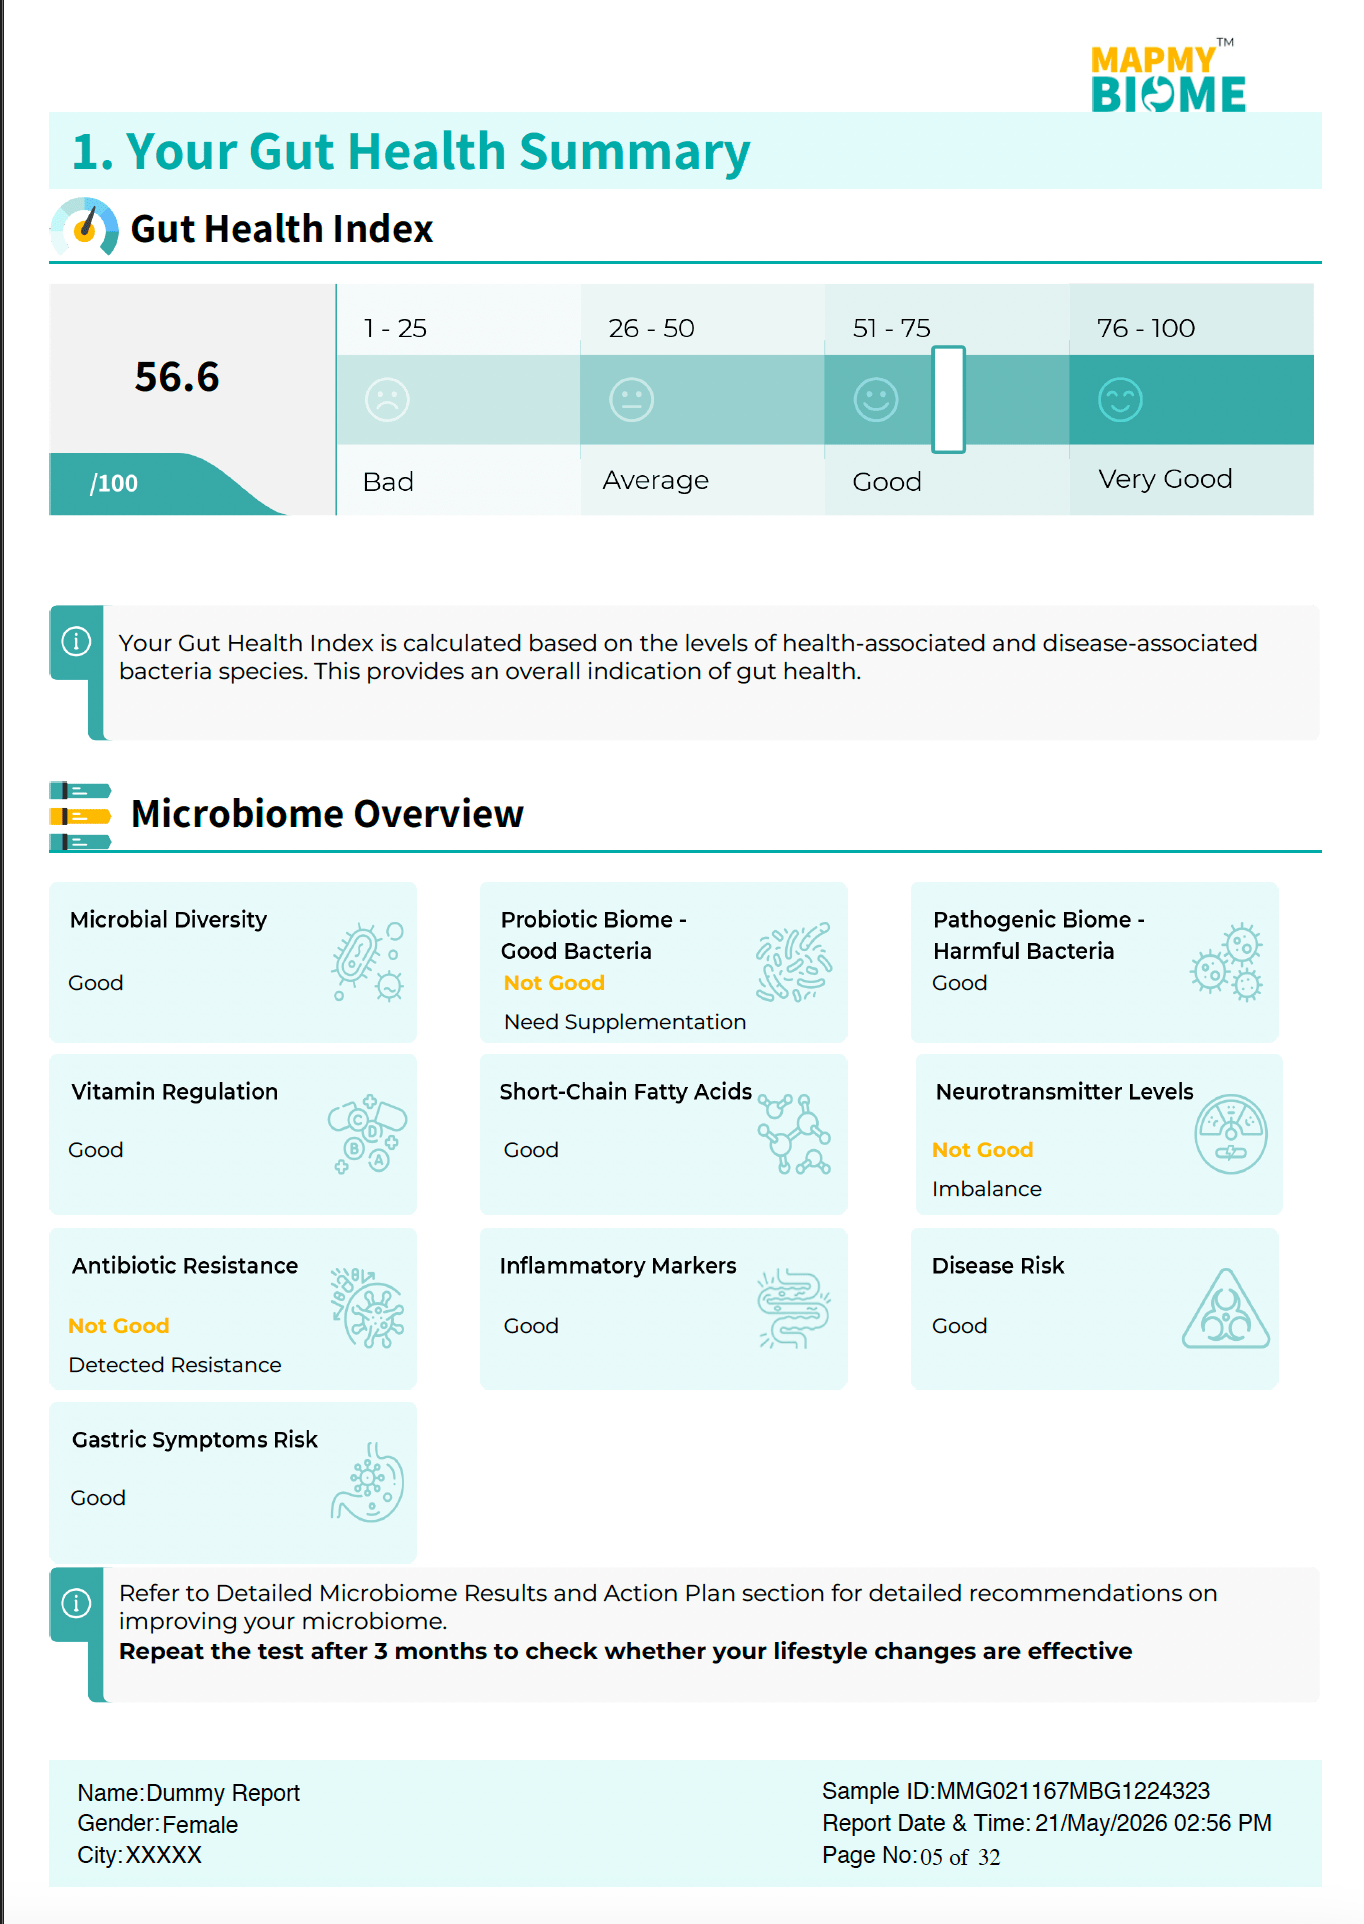
Gut Score
Scores range from 0-100; above 70 indicates a healthy, varied microbiome. Low scores (<40) signal imbalance, common in urban Indians due to processed foods.

Understanding Microbial Diversity
Microbial diversity measures the variety and balance of bacteria in your gut. Higher diversity often correlates with better resilience against diseases.

Good vs. Bad Bacteria Ratios
Aim for 80-90% beneficial bacteria (e.g., probiotics) vs. opportunists. A skewed ratio links to bloating or IBS.
Species-Level Identification
MapMyBiome uses shotgun sequencing for precise species detection, unlike basic tests.
- Key Bacterial Species Explained
Track Akkermansia for gut lining health or Faecalibacterium for anti-inflammation.
- What Bifidobacterium Levels Indicate
High levels (>5%) boost immunity; low ones suggest dairy intolerance, urging fermented foods like curd.
- Lactobacillus Strains for Indians
Strains like L. rhamnosus thrive on Indian staples—look for them to combat antibiotic overuse common in India.
- Firmicutes/Bacteroidetes Ratio
Ideal 1:1; high Firmicutes links to weight gain. Indians often skew higher from carb-heavy meals.

Functional Pathways Analysis
This advanced section maps what your microbes do, not just who they are.
- What Functional Pathways Are
Genes predicting metabolism, like breaking down carbs or producing vitamins.
- SCFA Production Levels
Short-chain fatty acids (SCFAs) like butyrate fuel gut cells; low levels (<medium) mean more fiber from millets.

- Vitamin Synthesis Capabilities
Check B12 or K production—vital for vegetarians dominant in India.

- Inflammation Markers: High LPS pathways signal chronic inflammation; MapMyBiome flags these early.
- Health Risk Assessment: Spot potential issues before symptoms arise.
- Disease-Associated Bacteria: Watch for high Desulfovibrio (IBD risk) or Enterobacteriaceae (infections).
- Antibiotic Resistance Genes: This reports list resistance to drugs like amoxicillin.